This is the second article covering creating a report using Microsoft Add-Ins for DevOps integration. If you miss setting up the add-ins, read this post: How to Create Project Report in Azure DevOps (ridilabs.net). This article will discuss creating a readable Excel report for project managers or product owners to understand their project progress.
Step 1 – Creating Query
Create your default query by visiting Boards à Backlogs à ... à Create Query.
Give the default name. And save it.

Step 2 – View the Query
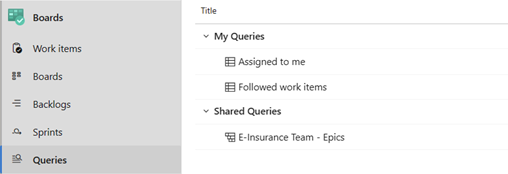
See your query by visiting Boards à Queries à All. You will find the query in the my queries or shared queries. It should be saved in shared or my queries.

Step 3 – Connect to the Query
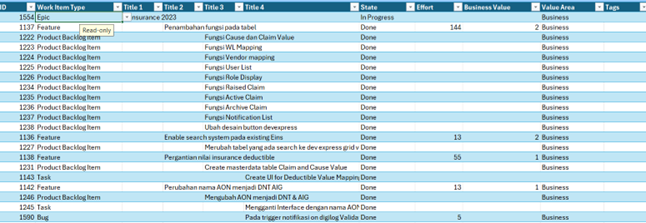
Like in the How to Create Project Report in Azure DevOps (ridilabs.net), you can connect by creating a new list. After that, you will get the default view, as shown below.

Step 4 – Configure the Query
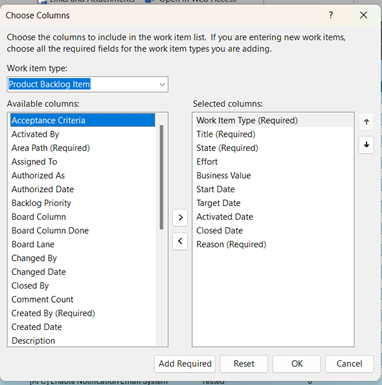
In the Team menu, select choose Columns

You should choose

- Work item type
- Title
- State
- Effort
- Business Value
- Start Date
- Target Date
- Activated Date
- Closed Date
- Reason
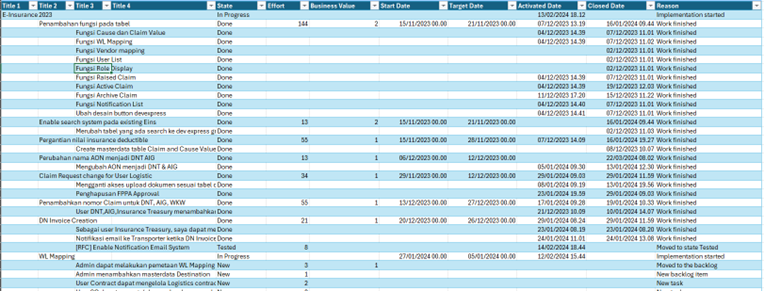
You will find this shiny report, feel free to filter your view such as product backlog, view, etc
