The Concept
Running application on top application is a great news! However, it does not mean that there is no problem within the solution. The codes sometime behave not right and you need to identify and fix it right away, In order to do that, monitoring and logging provides useful information to understand the behavior of the codes.
- Monitoring: a process to monitor a variable (metric) in the application
- Logging: a process to write useful information AND metric into a database or a storage
By default, logging is collecting data and monitoring is watching the data that is collected. After monitoring, the system can do two types activities:
- Act: for example, running a script, doing auto scale and notify the developer
- Analyze: for example, creating a report, show an anomaly, and metric math.
The Technology
In the cloud we have two technologies:
- Monitoring an application: for example: Amazon X-Ray or Azure App Insight
- Monitoring an infrastructure: for example: Amazon CloudWatch or Azure Monitor
The Metrics
What are recommended metrics to monitor and log, you can see the table
Stack | What to monitor |
Load Balancer | HTTP codes, Queue length, latency |
Virtual Machine | CPU usage, CPU credit, Memory, Status Check Failed |
Network | Network in and out, Latency |
I/O | Usage disk, disk write / disk read |
Application | Interested variables |
Auto Scaling | State of Instance (Start/Pending), Min / Max Group Size, 400 / 500 codes |
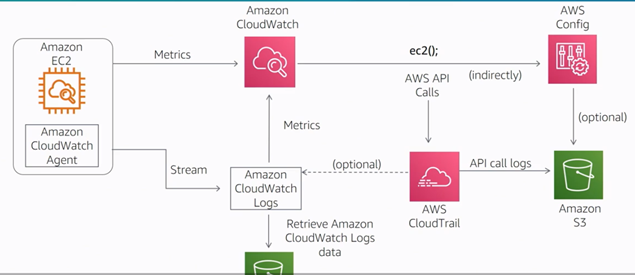
The Log Behavior
In general, the log will be stored in 15 months in major log services such as CloudWatch or Azure Monitor. However, you can make it persistent in storage such as blob or storage. Here is an example in AWS. You might want to monitor continuously by streaming the data. For example, when we are using IOT device. We can also provide tags to add useful information for our log.